Our Client
Our client is one of the largest snack food companies in the world, operating in over 150 countries with research and development facilities and distribution centers worldwide.
They are committed to continuous improvement, from building a world-class supply chain to achieving excellence in marketing and sales. A critical component of their operational success is digital transformation, which enables growth and provides a competitive advantage. They had already implemented modern machine learning platforms for sales forecasting. However, their next step was to apply explainability techniques to their forecasts, enabling business analysts and stakeholders to make informed decisions and helping decision-makers understand the rationale behind the sales predictions.
NEEDS & REQUIREMENTS
The project goals encompassed promoting transparency in machine learning model predictions, empowering decision-makers with data-driven insights into sales-driving factors and uncovering the complex relationship between sales and various factors, e.g. seasonality, distribution of goods in the network, promotions or cannibalization of products within the same group.
The client recognized that when end-users—whether business stakeholders or analysts—understand how a model operates and trust its predictions, they are more likely to adopt and use the technology. Achieving this trust required implementing explainability techniques that would clarify model outcomes, facilitate better decision-making around promotions, and provide benefits ranging from transparency in machine learning models and risk mitigation to valuable strategic insights and increased stakeholder confidence.

OUR APPROACH
We defined the client’s primary objective as building confidence in the forecasts among business departments and breaking down order volumes into contributing factors. Explainability was critical to demystifying the complexity of machine learning models, making them accessible to non-experts and fostering trust in the model’s predictions among business stakeholders.
We understood that the primary forecasting model was too complex to easily explain, so we needed to develop a simpler “proxy” model. However, the choice of whether to use the same algorithm or opt for a different one was not immediately clear. Additionally, we needed to reduce the initial set of over 600 features to approximately 100 while determining which features were most relevant for selection.
For the explainability method, we selected SHAP (SHapley Additive exPlanations), a post-hoc local technique based on Shapley values from game theory. In this context, each feature contributes as part of a “coalition” that influences the final prediction outcome.
We introduced some quasi-linear transformations to translate the Shapley values into the decomposition of the forecast into its components described by the features. For this reason, in the detailed sections of the article below, there will be a note about “decomposition” in relation to the forecast explainability.
OUR SOLUTION
Our solution was executed in the following phases:
Step 1: Input Data Preparation
Data preparation is a critical initial step. It involves collecting, transforming, and organizing the data needed for model development, decomposition calculations, and explainability analysis. Properly prepared data ensures the accuracy and reliability of the subsequent steps.
Step 2: Building the Proxy Model
We started by carefully selecting key features based on business definitions. Hyperparameter optimization followed, which played a pivotal role in fine-tuning the LightGBM model using a Bayesian optimization approach. This process enhanced the proxy model’s accuracy, albeit with a slight overfitting designed to improve decomposition (explainability) calculations.
The trained and fine-tuned model was ready to make predictions, and we monitored its training process using evaluation sets that included both training and testing data for iterative performance assessment. This proxy model was then prepared for use in the explainer, the core component of the explainability process.
Step 3: Explainer Training and Calculation of Shapley Values
Shapley values, derived from cooperative game theory, provide a systematic and intuitive method for understanding each feature’s contribution to a model’s prediction. These values offer insight into how individual features influence the final sales quantity prediction, shedding light on the “why” behind each forecast.
To calculate these values, we used the previously trained LightGBM model.
Step 4: Post-Processing Shapley Values
Once the Shapley values were calculated, the next step was to post-process and aggregate the feature contributions to enhance their interpretability. This step was crucial in ensuring that the results could be easily understood and integrated into the existing dataset for further analysis.
Step 5: Transformation of Shapley Values into Historical and Short-Term Forecast Decompositions
At this stage, the Shapley values were transformed into meaningful decompositions for both historical and short-term forecasts (the next three months), providing insights into the factors driving the sales predictions. These decompositions revealed whether the impact of each factor was positive or negative, with the total at the individual observation level always summing to the actual quantity for historical data or the forecasted quantity for short-term predictions.
Step 6: Calculation of Long-Term Forecast Decomposition
Using the short-term forecast decomposition as a foundation, we extended the process to generate long-term forecast decompositions (the next year). Key elements of this phase included:
- Filtering data by specific categories.
- Applying constraints to the date horizon for forecast calculations.
- Preparing train and test datasets for decomposition prediction.
- Optimizing hyperparameters for model performance.
- Training the LightGBM model to predict decomposition components.
- Post-processing and validating decomposition results to ensure accuracy.
CHALLENGES AND INSIGHTS
Throughout the project, we encountered challenges in translating the technical outputs into meaningful business insights. For example, the initial results raised questions from the client’s business experts, such as how promotional effects could be negative or why SHAP values were consistently negative for low-volume time series.
Through collaborative discussions, we discovered that constant promotions had established a baseline, resulting in promotional effects appearing less impactful.
Additionally, some feature definitions led to ambiguous SHAP values, prompting the need for redefinition. To improve interpretability, features were chosen based on their clarity and business relevance.
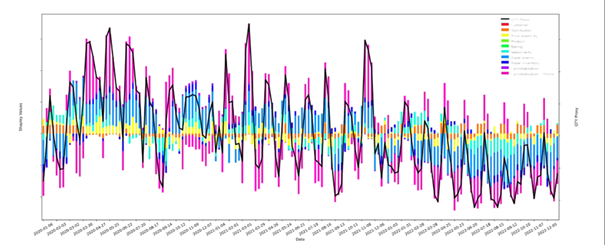
The raw SHAP output, presented below, which referenced a mean, was not easily applicable for business purposes.

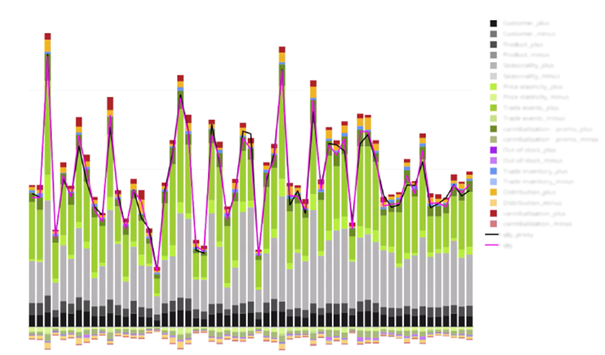
Therefore, we applied quasi-linear transformations to make the results more interpretable. The chart below clearly illustrates how specific features influence the overall effect of the promotion.

THE RESULTS
In any project, success hinges on clearly identifying goals, understanding the audience, and choosing the right methodology. However, testing the solution with the business and incorporating their feedback is equally critical. In our case, suggestions from the client’s business teams led to a better-calibrated, more interpretable solution.
As a result of this project, a complex, multi-stage forecasting process became transparent and understandable to end-users, instilling confidence in the outcomes. The model’s performance can now be easily monitored by observing its reactions to diverse inputs, making it easier to identify shifts in outputs. Ultimately, the forecasting process shed its “black box” nature, transforming into a tool that is trusted and actionable for the business.
CONTACT US
Ready to see how explainable Machine Learning can transform your business? Fill out our contact form and let’s explore the possibilities together.

