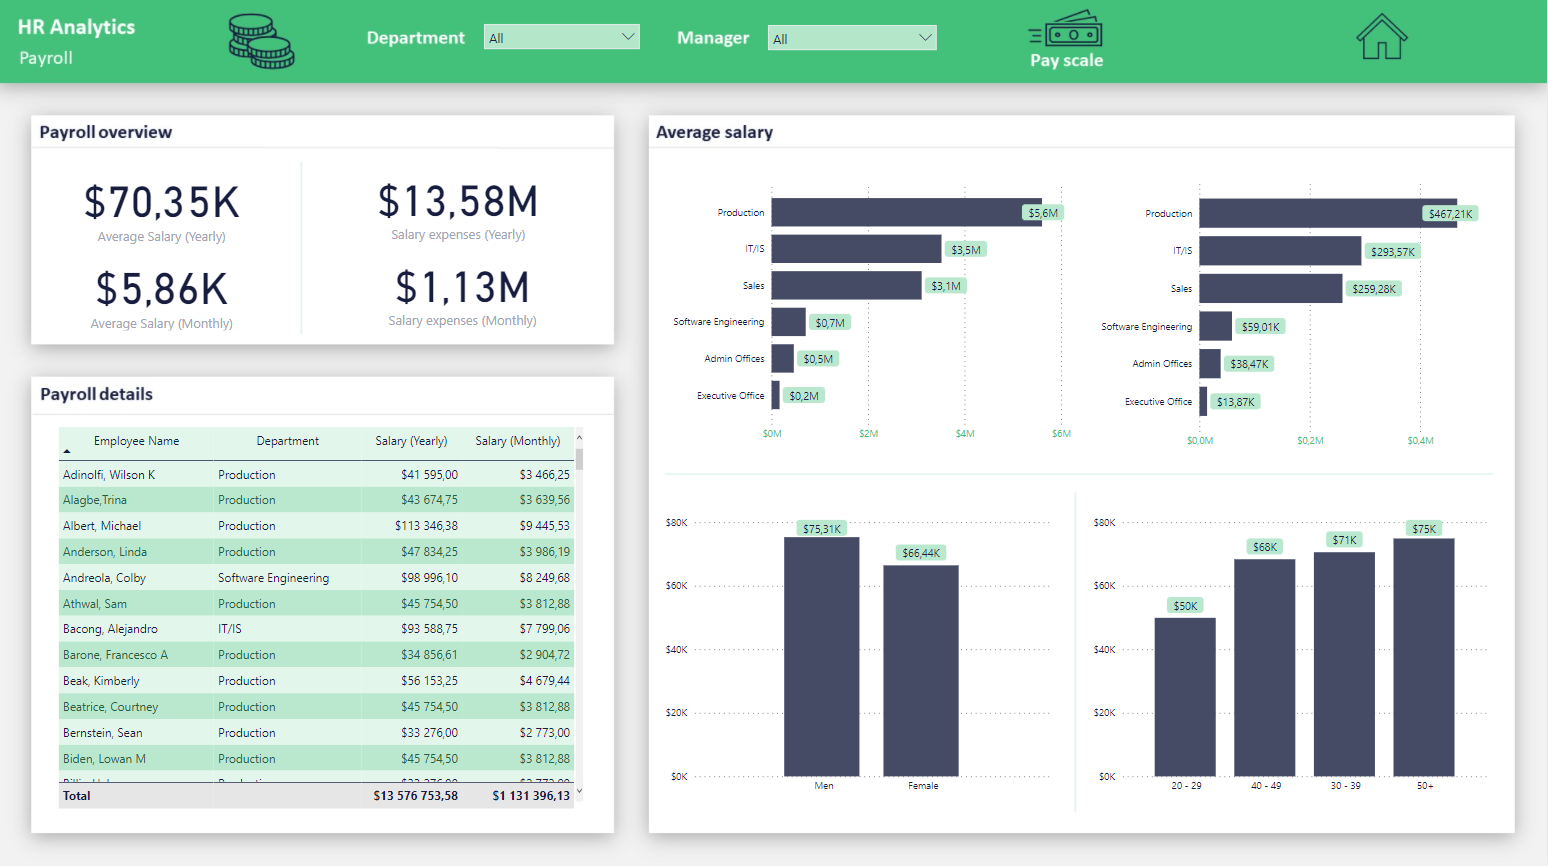
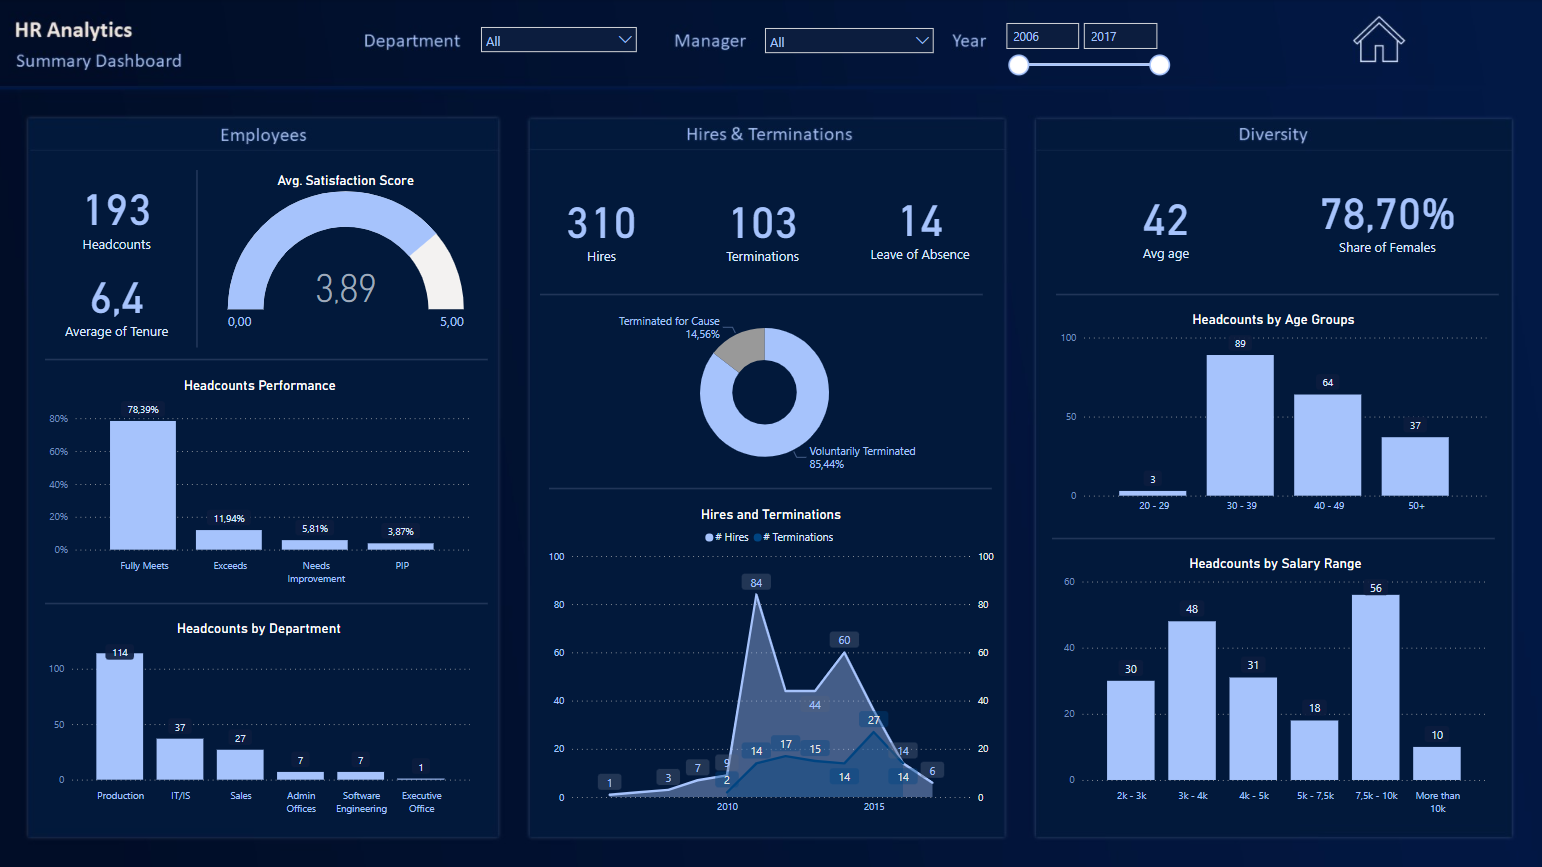
Human resources analytics – payroll overview


Unlock business intelligence by extracting knowledge from data, turning it into actionable insights, and applying it daily for a competitive edge. Advanced analytics provide precise information to make better data-driven business decisions, enhancing overall performance and strategy.
Create interactive KPI dashboards
for your business and bring your data to life.
01
with automated, reliable reporting from
numerous perspectives and reduce the risk of
human error, cost, and time.
02
to make the right decisions at the right time with customized UI and UX to optimize and improve information experiences
to end users.
03
with all the needed infrastructure, data integration, and data governance required to run a business smoothly.
04
in a fully automated and flexible manner enabling a single dashboard for all levels of managers with restricted data access.
Prototype in just 4 weeks.
We run workshops to gather requirements from business users and assess business goals.
We collect, clean, transform and integrate data to build a prototype for testing the concept.
We analyze data, discover patterns and get insights to help solve business problems.
We create data visualizations, interactive operational dashboards, reports with KPIs, and the most important information to make faster, more informed, data-driven decisions.

Product and Service Profitability; Sales Performance; Customer Service Analysis; Promotion Effectiveness Analysis

P&L; Controlling; Tracking Revenues & Profits; Costs & Expenses Monitoring; Budget Planning; Invoice Analysis;

Employee and Department Performance; Employee Satisfaction; Retention; New-Hire; Payroll; Travel Expenses;

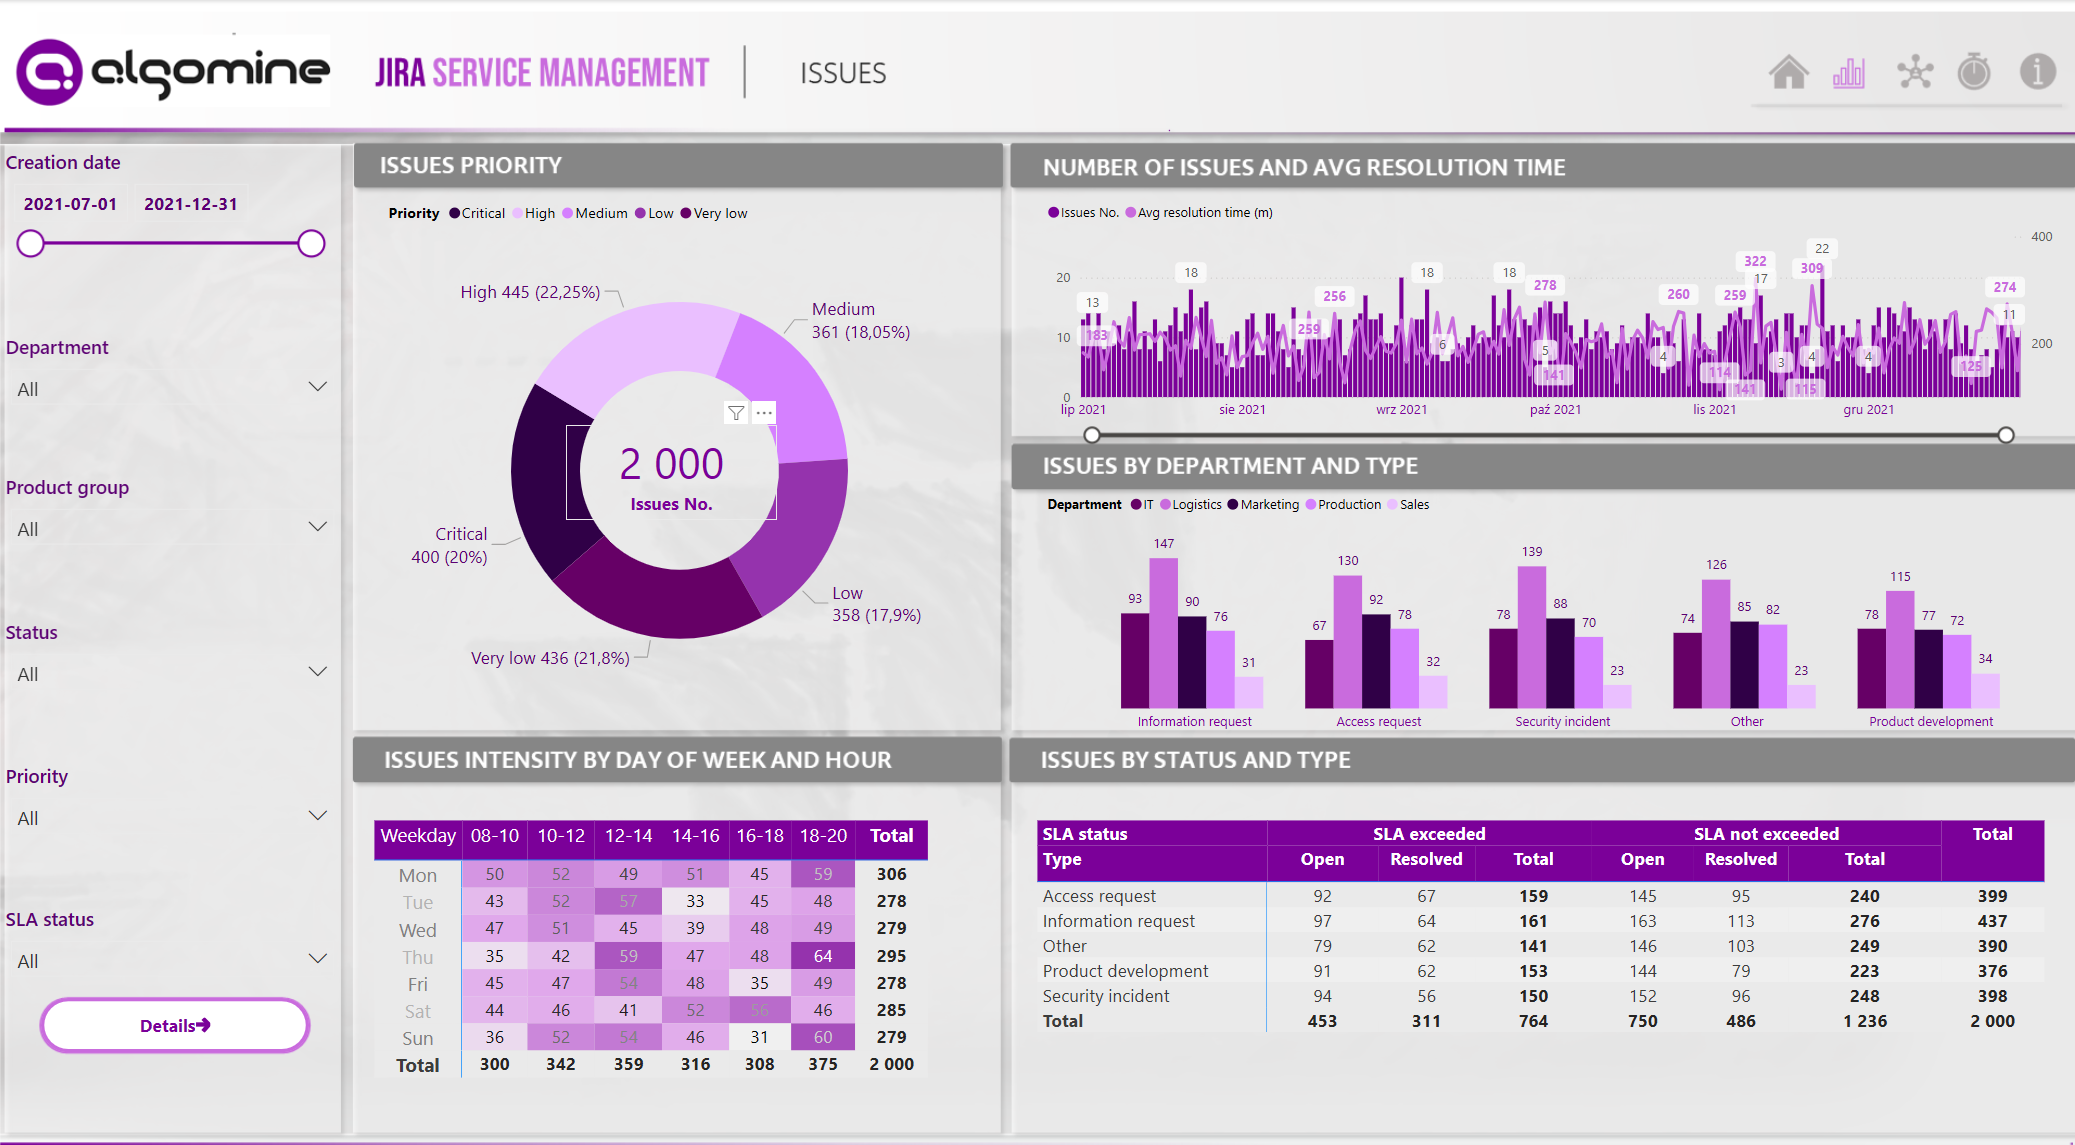
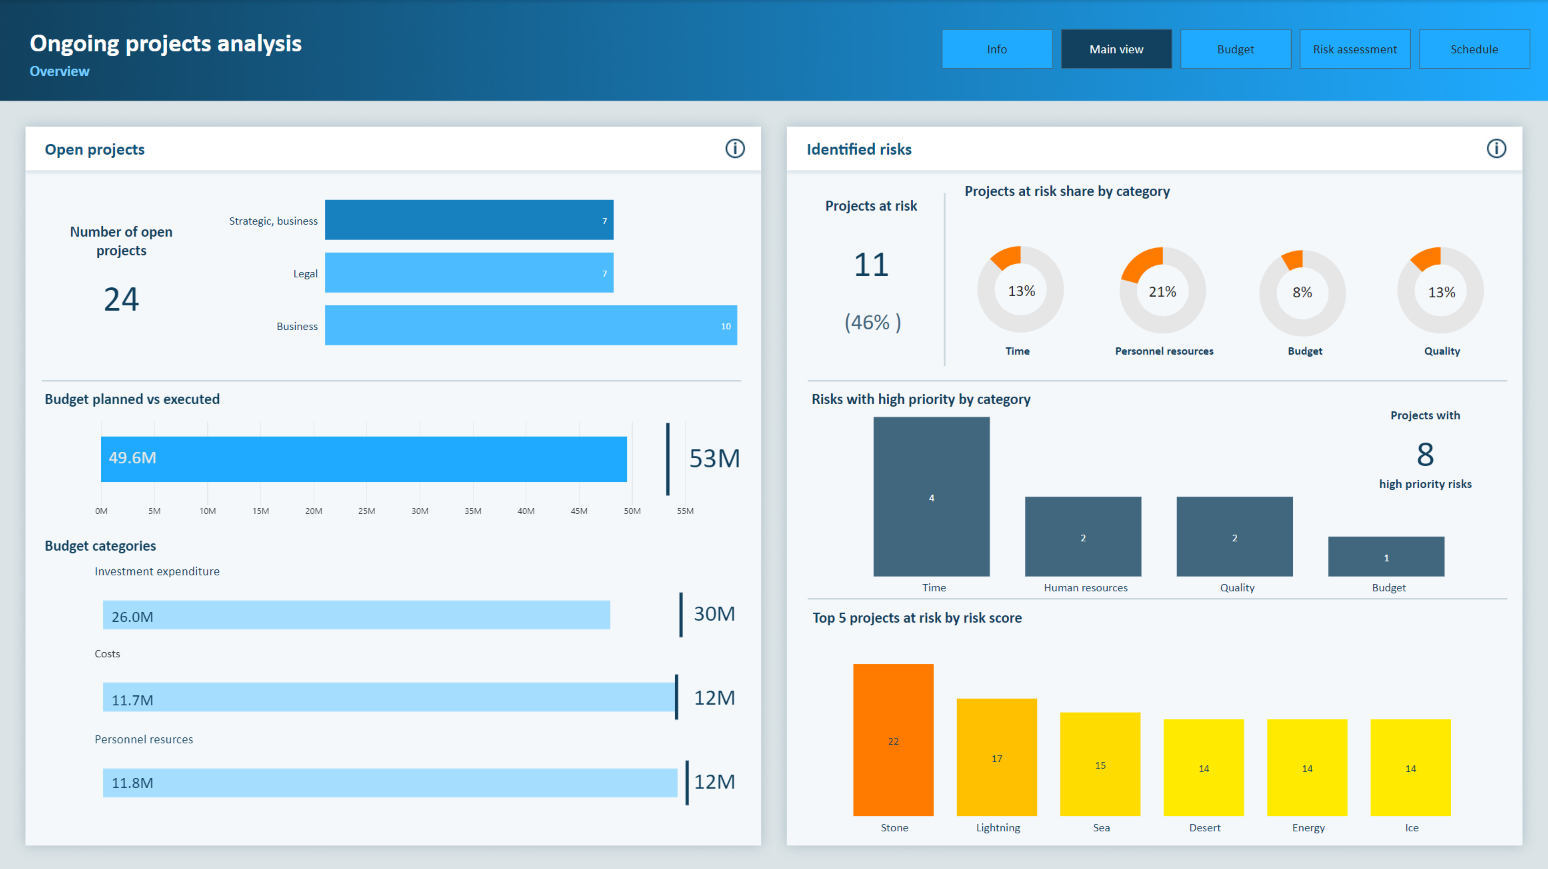
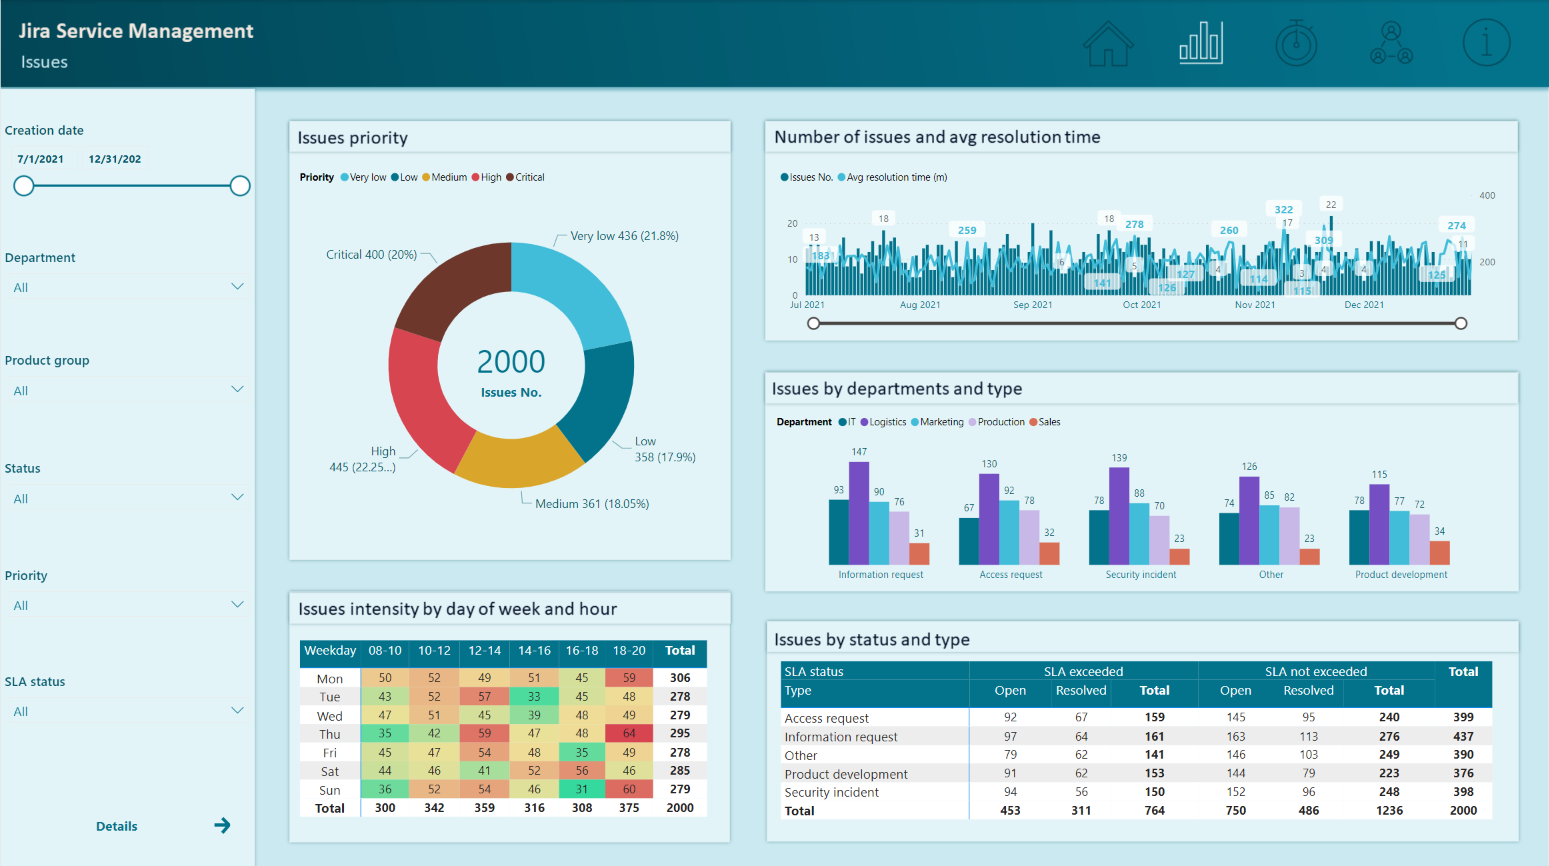
JIRA PMO - Project Costs Analysis; JIRA Service Desk – Licensing, Maintenance Monitoring, and Outsourcing SLA Analysis;

Demand Planning; Inventory Optimization; Vendors, Logistics, Delivery, and Order Management;

OEE; Quality Management; Fault Tolerance & Alarm Monitoring; Workforce and Capacity Planning; Material Wastage Analysis;

Maintenance Scheduling; Asset Lifecycle & Effectiveness Analysis; Resources Monitoring & Tracking;
Create interactive KPI dashboards
for your business and bring your data to life.