
Our Client
USP Zdrowie is a leading over-the-counter (OTC) medicines manufacturer in Poland.
The company was founded in 1992 and is currently a part of a group present in 12 European countries. The product portfolio comprises over 40 leading brands on the Polish market for OTC products. The company employs nearly 700 people in the offices, laboratories, and R&D centers.
NEEDS & REQUIREMENTS
The company heavily relies on long-term production and supply plans, which are difficult to prepare and bear a high risk of error. Additionally, long-term sales forecasts are used for cash-flow, controlling, budgeting, and setting up sales targets. Before the project began, these forecasts were prepared manually through planning sessions involving employees from various departments. To optimize and automate this process, the client decided to use Machine Learning and reached out to Algomine.
The scope of the project included implementing the entire forecasting process, from data preparation and model training to result serving.
The main goals of the project were to:
- Generate forecasts at a lower level of aggregation.
- Significantly reduce the preparation time without decreasing the quality of the results.
- Integrate various sources of data (warehouse, databases, files).
- Design easy-to-use interactive dashboards to monitor and analyze KPI

OUR APPROACH
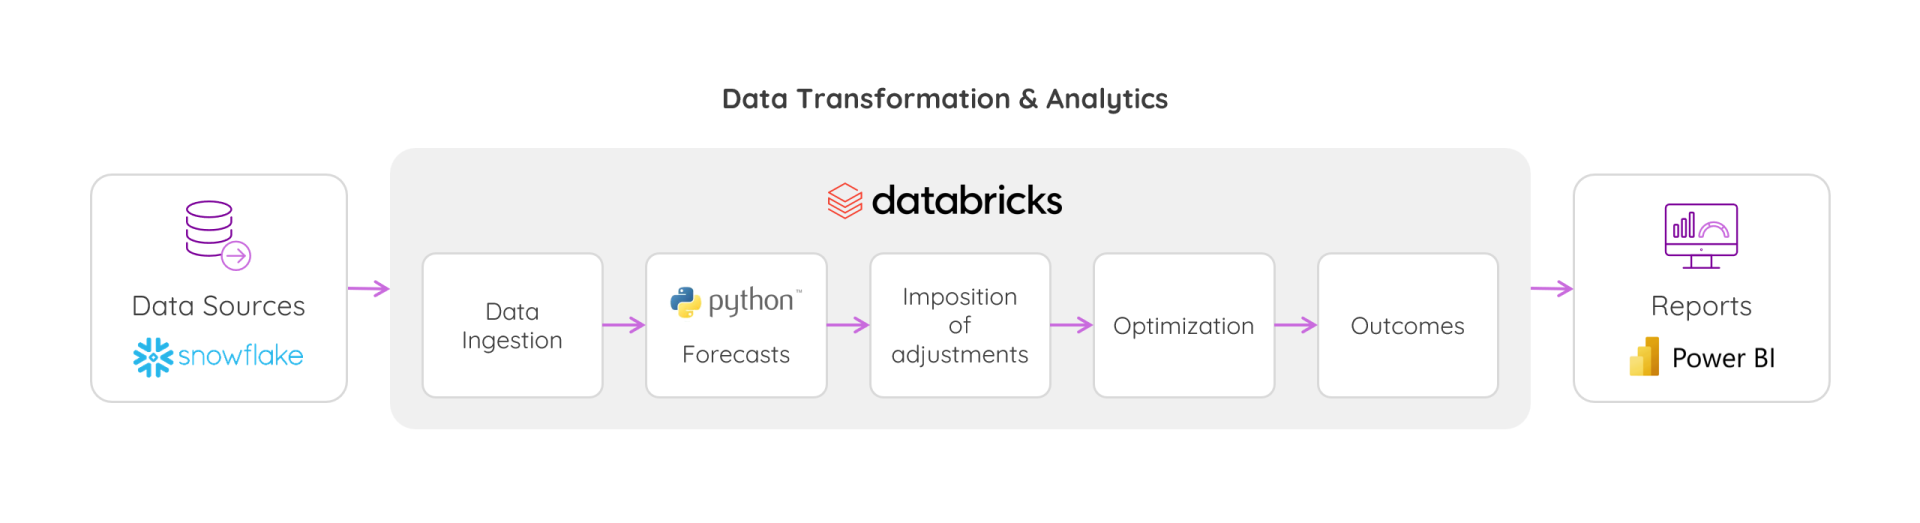
After conducting a business analysis, we identified five key variables that the client monitored and used operationally: sales, two groups of orders, stocks, and total market value. We built a separate forecasting pipeline for each of these variables, consisting of ETL processes, model training, and result post-processing. The forecasting covered all of the client’s products sold in pharmacies.

“We had to design a number of custom algorithms in this project: disaggregation of sales history, result calibration, or new product forecasting. They required an extra effort from data scientists, which additionally challenged the tight schedule.”– Piotr Żak, Data Scientist, Algomine
Thanks to the seamless cooperation between the Algomine team and the client’s experts, we were able to implement the ML models in just 12 weeks. The clear and precise expectations from the client’s experts played a crucial role in the project’s success, according to Igor Jakubiak, the Lead Data Scientist.
“Daily meetings at the analysis stage allowed us to build a good understanding of the business and customer expectations. The expert knowledge of the client’s team members often became a direct input in the analytical process.”– Igor Jakubiak, Lead Data Scientist, Algomine
OUR SOLUTION
We set up a cloud-based analytical environment using Azure Databricks, saving plenty of time on software installation and configuration.
FORECASTING MODELS
As a first step, we integrated external and internal data sources, unified and deduplicated product IDs, and started working on feature engineering. The models were trained on the history of each key variable, product and distribution network characteristics, as well as calendar-based events.
Data scientists then built machine learning pipelines, a series of transformations that prepare the data for modeling and then train and test the model. We used the Gradient Boosting algorithm to generate the forecasts, and all the calculations, including model estimation, were implemented on Spark’s distributed computation engine.
At the final stage of validating and monitoring the results, an additional step was included in the forecasting process to decrease the model’s sensitivity to data anomalies. The forecasts, refreshed every month, were not allowed to change significantly between two consecutive calculations. Therefore, the long-term forecasts do not show rapid swings arising from singular disturbances. However, if the disturbance shows up repeatedly, it is gradually taken into account by the model.
“The forecasts generated by new analytical system are used for high-level planning of the sales process. This means that a number of conditions must be taken into account, not only at the level of a single model, but also between subsequent calculations. The analytical processes in the model, tailored to the specifics of our company, cover our most detailed expectations.”– The project’s Sponsor
REPORTING
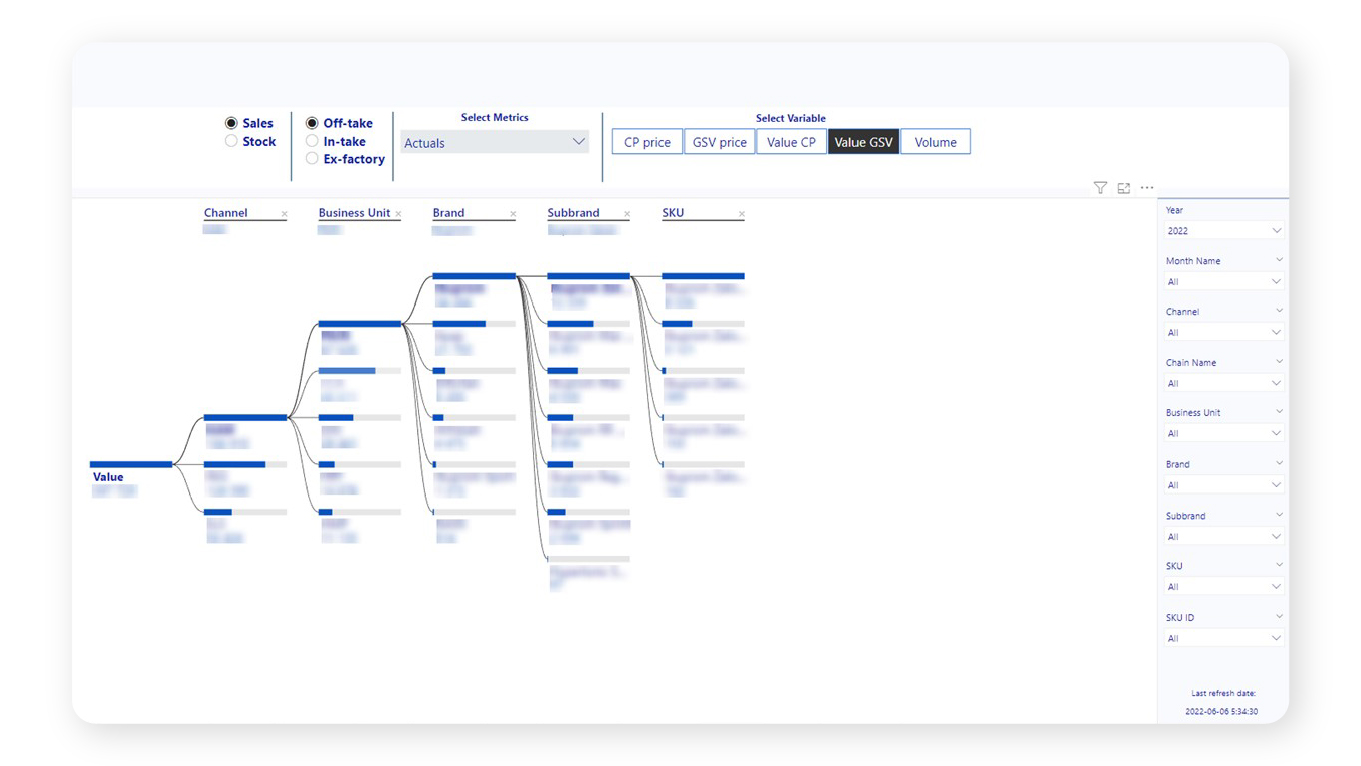
We designed and developed a dashboard containing a set of reports with user-friendly interface to monitor KPIs with ability to compare results in multiple dimensions. The Power BI reports enabled product managers to monitor forecast product demand for the coming 18 months. For their part, users were now able to drill into all channels, chain names, business units, brands and sub-brands to investigate competing products.
The solution allows to compare actual and historical results, forecasts, and plans to analyze the results’ adequacy and progress in achieving the assumed results.
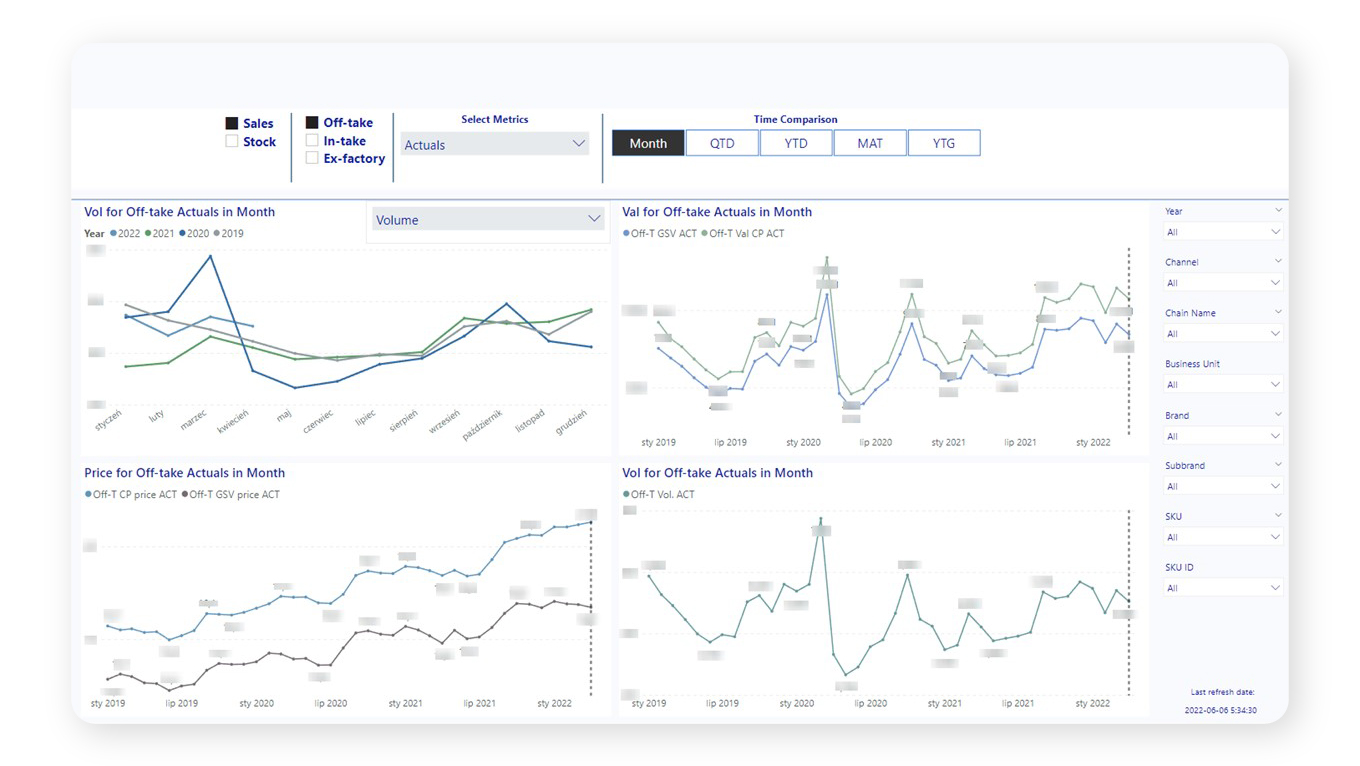
Reports allow business users to slice and dice data according to various dimensions. Depending on their needs, users can filter the reports by Sales and Stock, other available variables such as Price, Value, or Volume, comparison periods, or other metrics related to forecasting. Additionally, there’s a side pane on each page of the report where users can focus on specific filtering options and access more in-depth information, such as Brand or Chain Name.
We implemented the concept of dividing report pages into timelines presenting data or insights over different time periods or stages. This allows users to interactively explore data for various intervals, such as:
- H1 or H2 (first and second half of the year)
- Year to Date (focuses on presenting data from the beginning of the current year up to the present date)
- Year to Go (focuses on projecting data from the present date until the end of the current year)
- Moving Annual Total (focuses on the last 12 months of data from the current date – as time advances, the timeline automatically shifts to include the most recent 12-month data window)
- Basic timeliness (days, weeks, months, quarters, or years)
Regular meetings with the client, showing subsequent stages of the created report, helped in the current adjustment of work directions to precisely meet the reporting needs. During the report development, we paid attention to the “top-down” approach in presenting information, to identify the big picture and all of its components, facilitate drawing conclusions, and shorten the time needed for the report user to analyze the data.
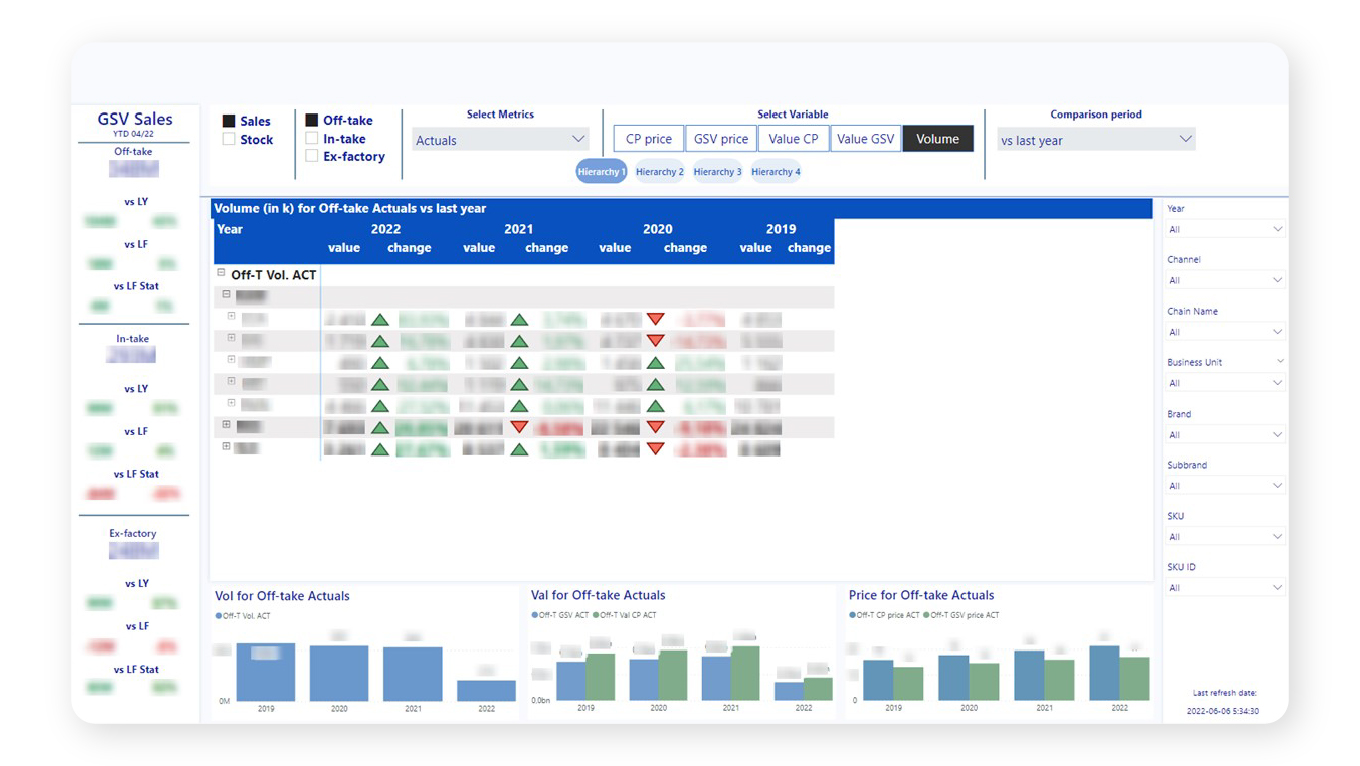
An important element in the construction of reports was the use of graphic elements, despite the need to present a large amount of numerical data. For visual purposes, we used, among others, tables with conditional formatting options to make them more intuitive to read and focus on trends, thus facilitating data interpretation. We also used line charts which are effective for showing trends over time and use data points to make it easier to see the progression of the data.
This helped product managers answer important business questions like:
- What is the share of individual sales channels, brands, and products?
- How have sales changed in relation to the previous year, selected forecast, plan?
- Which products are likely to be market leaders?
- Based on competitor momentum, where should we prioritize marketing spend?
- How much of a given product should we manufacture in the next X months?
- Where have we reported the most impacting change in sales?
THE RESULTS
The implemented solution fully automated the forecasting process and immediately displayed results in the form of reports for business users.
The results were as follows:
- Forecast generation time was significantly reduced.
- Automation – the forecasts are now generated automatically, requiring only one person, in comparison to a team of several analysts.
- Repeatability – the results are consistent for the same input data, independent of the expertise of demand planning specialists, whose predictions are subjective and may vary over time.
- The prediction error is comparable to expert forecasts, but ML forecasts are generated on a much lower level – individually for over 30 distribution networks
The forecasts of all five key variables, across the entire product portfolio, are now accessible throughout the organization.
“The main effect of implementing the forecasting system is the acceleration, automation, and repeatability of the process that was previously based on the expert knowledge of planners.
Currently, new versions of forecasts are ready within hours of data release, do not require the participation of a business or technical specialist, and guarantee that the results are generated based on the same algorithm every time.”– Igor Jakubiak, Lead Data Scientist, Algomine
ML models generate forecasts for over 200 products and are based on sales reports for each brand. The data originate from either internal or external sources.
Forecasts cover 18 months and include the following categories:
- Sales to consumers (quantitative, in retail prices, and in wholesale prices), which translate into the demand – the most important variable.
- Sales to partners – pharmacy networks.
- Stock fluctuations in contractors’ pharmacies and warehouses – simulation of changes.
- Direct orders by key partners (no intermediaries).
Quantitative forecasts allow us to estimate the wholesale and market value of sales, and thus market shares for products, brands, or categories.
Additionally, the data from external sources make it possible to estimate the further development of the whole OTC drugs market.